Published
- 4 min read
Performance Optimization Techniques in Python

Performance Optimization Techniques in Python
Optimizing performance in Python is crucial for developing efficient and scalable applications.
Introduction
Python is a versatile and widely-used programming language known for its simplicity and readability. However, Python’s dynamic nature can sometimes lead to performance bottlenecks. This article explores various techniques to optimize Python code, making it faster and more efficient. Whether you’re a beginner or an experienced developer, these strategies will help you enhance the performance of your Python applications.
Understanding Performance Bottlenecks
Before diving into optimization techniques, it’s essential to identify the performance bottlenecks in your code. Common areas include:
- Inefficient algorithms: Using suboptimal algorithms can significantly slow down your application.
- Excessive memory usage: High memory consumption can lead to slower execution times.
- I/O operations: Reading from or writing to files and databases can be time-consuming.
- Network latency: Delays in network communication can impact performance.
Techniques for Performance Optimization
1. Profiling Your Code
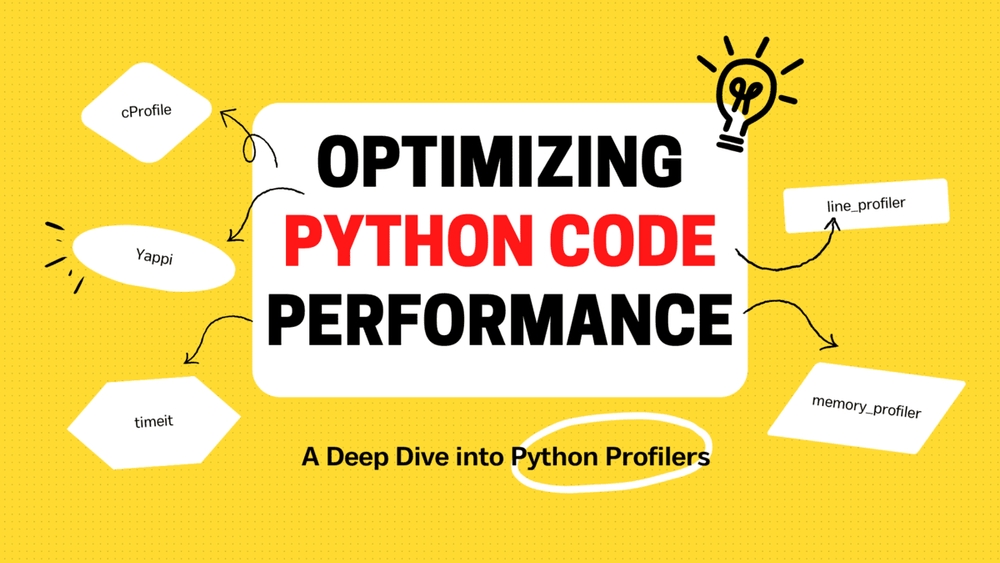
Profiling is the first step in performance optimization. It helps identify the parts of your code that consume the most time and resources. Python provides several profiling tools, such as:
- cProfile: A built-in module that provides a detailed report of function calls.
- line_profiler: A third-party tool that offers line-by-line profiling.
Example: Using cProfile
       import cProfile

def my_function():
    # Your code here
    pass

cProfile.run('my_function()')
2. Using Efficient Data Structures
Choosing the right data structure can have a significant impact on performance. Consider using:
- Lists for dynamic arrays.
- Dictionaries for fast lookups.
- Sets for unique elements and membership tests.
Example: Dictionary vs. List
       # Using a list
items = ['apple', 'banana', 'cherry']
if 'banana' in items:
    print('Found!')

# Using a dictionary
items = {'apple': True, 'banana': True, 'cherry': True}
if 'banana' in items:
    print('Found!')
3. Leveraging Built-in Functions
Python’s built-in functions are implemented in C and are highly optimized. Use functions like sum(), min(), max(), and sorted() for better performance.
Example: Using sum()
       numbers = [1, 2, 3, 4, 5]
total = sum(numbers)
4. Avoiding Global Variables
Global variables can slow down your code due to the need for global lookups. Use local variables within functions to improve speed.
5. Using List Comprehensions
List comprehensions are more efficient than traditional loops for creating lists. They are concise and often faster.
       # Traditional loop
squares = []
for i in range(10):
    squares.append(i * i)

# List comprehension
squares = [i * i for i in range(10)]
6. Implementing Caching
Caching can significantly reduce computation time by storing the results of expensive function calls. Use the functools.lru_cache decorator to cache function outputs.
       from functools import lru_cache

@lru_cache(maxsize=None)
def fibonacci(n):
    if n < 2:
        return n
    return fibonacci(n-1) + fibonacci(n-2)
7. Parallelizing Code
Take advantage of multi-core processors by parallelizing your code. Use the concurrent.futures module for simple parallel execution.
       from concurrent.futures import ThreadPoolExecutor

def process_data(data):
    # Process data
    pass

with ThreadPoolExecutor() as executor:
    executor.map(process_data, data_list)
8. Using External Libraries
For computationally intensive tasks, consider using external libraries like NumPy and Pandas, which are optimized for performance.
Example: Using NumPy
       import numpy as np

# Create a large array
array = np.arange(1000000)

# Perform operations
result = np.sum(array)
Advanced Topics
Memory Management
Efficient memory management is crucial for optimizing performance. Python provides several tools and techniques for managing memory usage:
- Garbage Collection: Python’s garbage collector automatically manages memory allocation and deallocation. Use the
gcmodule to control garbage collection. - Memory Profiling: Use tools like
memory_profilerto analyze memory usage and identify memory leaks.
Concurrency and Parallelism
Python supports concurrency and parallelism through various modules and libraries:
- Threading: Use the
threadingmodule for concurrent execution of tasks. - Multiprocessing: Use the
multiprocessingmodule for parallel execution of tasks across multiple CPU cores.
Profiling Tools
In addition to cProfile and line_profiler, consider using:
- Py-Spy: A sampling profiler for Python that provides real-time performance insights.
- Scalene: A high-performance, high-precision CPU, GPU, and memory profiler for Python.
Real-World Examples and Case Studies
Case Study: Optimizing a Web Application
In this case study, we’ll explore how a team optimized a Python-based web application to handle increased traffic and improve response times. The team used profiling tools to identify bottlenecks, implemented caching to reduce database queries, and parallelized I/O operations to improve throughput.
Example: Data Processing Pipeline
We’ll examine a data processing pipeline that processes large datasets using Python. The pipeline was optimized by using efficient data structures, leveraging external libraries, and parallelizing data processing tasks.
Conclusion
Optimizing Python code is an essential skill for developers aiming to build efficient and scalable applications. By profiling your code, choosing the right data structures, leveraging built-in functions, and implementing caching and parallelization, you can significantly enhance the performance of your Python programs. Remember, optimization is an iterative process, and continuous profiling and testing are key to achieving the best results.
References and Further Reading
- Python Performance Tips
- NumPy Documentation
- Pandas Documentation
- Python Concurrency and Parallelism
- Memory Management in Python